Pack 1: Essential Order Flow
The 3 fundamental tools to decode institutional intent and trade like a professional
Special Offer for Heatmap Pro Customers
Already own DynamiDOM Heatmap Pro V1?
Get -20% off Pack 1 as soon as it launches! 🎁
⚠️ The Problems You're Facing
Without these tools, you're trading blind against institutional players
Information Overload
Too much data in the SuperDOM; impossible to know where to look in real-time to detect institutional intent.
Mental Lag
You're analyzing numbers while the pros act on instant, automated visual signals.
Manipulation
Impossible to distinguish real institutional orders from spoofing and fake walls without advanced tools.
What's Inside Pack 1
3 professional SuperDOM columns to master Order Flow
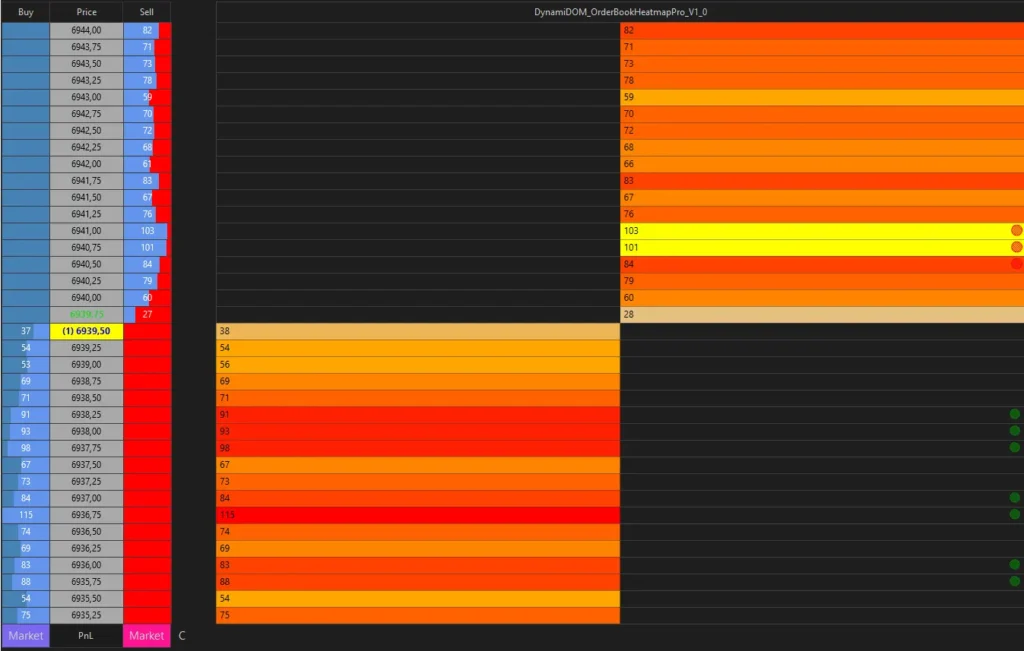
DynamiDOM Heatmap Pro
Your historical visual radar for the order book
🔥 Problem Solved:
"The order book moves too fast... it's impossible to remember where the big walls were!"
✅ Solution:
- Records and visualizes the complete DOM history
- Color gradients revealing institutional liquidity zones
- Instantly spots real support/resistance based on past liquidity
💡 Concrete Benefit:
Trade with a panoramic view of the market - see where institutional orders are coming from and anticipate reactions at key levels.
Why: Institutions leave traces in the order book. These "footprints" reveal their defense and accumulation levels.
When to use: Always. The Heatmap provides the essential historical context for all your decisions.
How: Identify zones where historical volume concentrated (intense red = high past liquidity). These zones act as magnets for price.
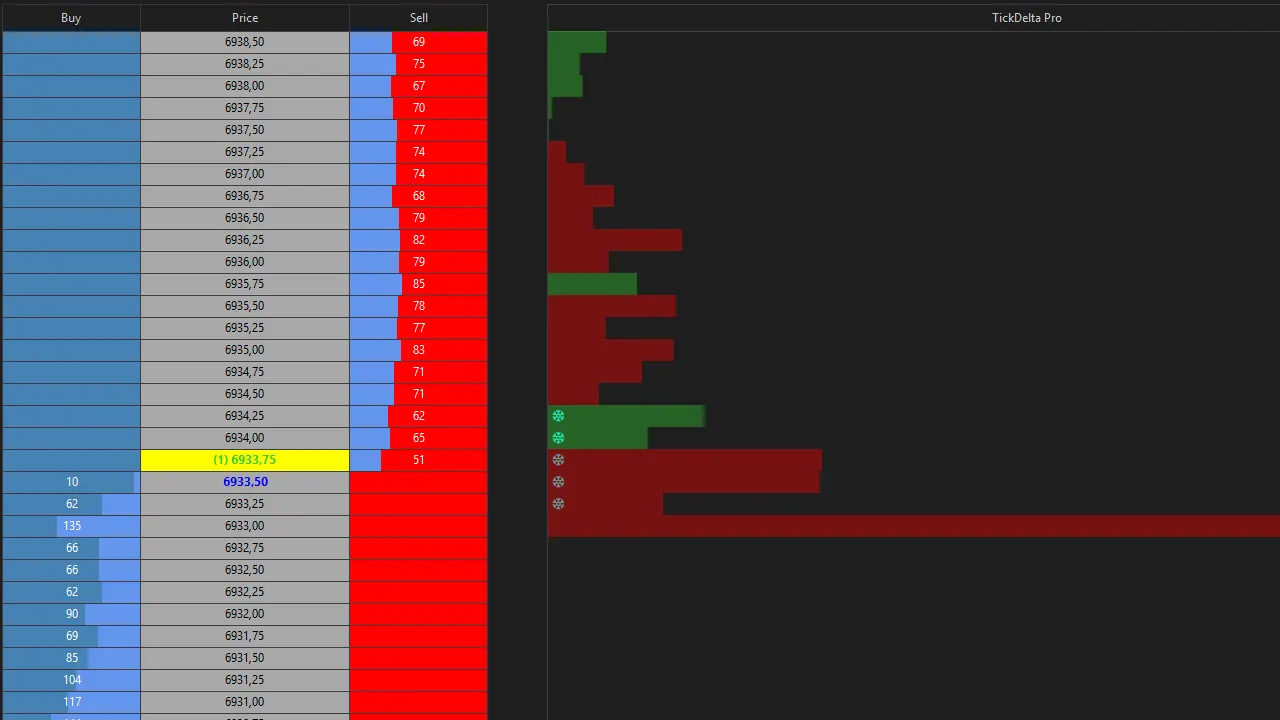
OrderFlow Tracker Pro
The real-time buy/sell pressure detector
🔥 Problem Solved:
"Price is going up... but is it real buying or manipulation?"
✅ Solution:
- Calculates cumulative delta (buyers vs sellers) tick by tick
- Automatically detects institutional absorption (🛡️)
- Identifies icebergs (❄️) and spoofing (fake walls)
💡 Concrete Benefit:
Avoid fake breakouts and confirm your entries with objective real-time institutional pressure data.
Why: Delta reveals the imbalance between buying and selling pressure. Icebergs signal massive institutional orders absorbing opposing pressure.
When to use: At decision points (support/resistance, breakouts) to confirm or invalidate your directional thesis.
How: Look for divergences: price rising but negative delta = weakness. Iceberg (❄️) = solid institutional wall, usually a reversal point.
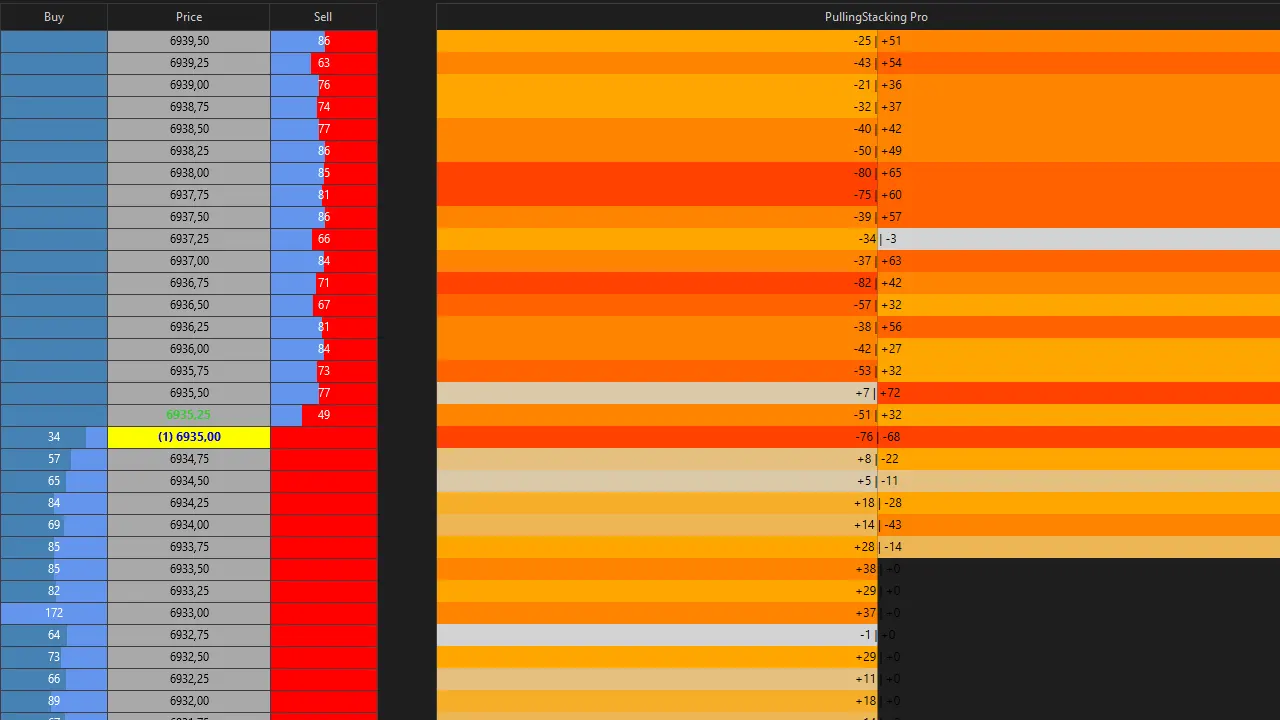
Liquidity Pulse Pro
The dynamic real-time liquidity monitor
🔥 Problem Solved:
"Orders appear and disappear in the DOM... how do I know if it's serious?"
✅ Solution:
- Tracks liquidity additions/removals in real-time (Pulling & Stacking)
- Color gradients revealing accumulation/distribution zones
- Detects "fake liquidity" (massive pulling right before a move)
💡 Concrete Benefit:
Anticipate price movements before they happen by tracking institutional liquidity flows.
Why: Institutions "prepare" their moves by adding or removing liquidity. These flows reveal their true intentions.
When to use: Just before key zones. Pulling/stacking often precedes major directional moves.
How: Stacking (progressive additions) = conviction. Massive pulling on the opposite side = probable manipulation. Combine with OrderFlow for confirmation.
🔗 How These Tools Work Together
A complete ecosystem for informed decision-making
Real Scenario: Scalping a Reversal on ES
🗺️ Heatmap Pro reveals a massive historical wall at 5850.00
Level defended 3 times in the last 2 hours → Strong institutional support (intense red zone on Heatmap)
📊 OrderFlow Tracker Pro detects massive absorption at 5850.25
Institutional iceberg (❄️) appears + Sell Delta goes from -800 to -200 in 30 seconds → Sellers are exhausting against a wall of buying
💧 Liquidity Pulse Pro shows massive stacking on the BID side
+2500 contracts added across 3 BID levels, no pulling → Institutions are reinforcing their position, buyer conviction confirmed
✅ Result: High Probability Buy Signal
BUY entry at 5850.50 confirmed by 3 converging data sources: historical, real-time flow, and liquidity structure.
🎯 Stop Loss: 5849.75 (below iceberg)
🎯 Take Profit: 5853.00 (1:3 ratio)
📊 Risk: 3 ticks (0.75 pts)
💰 Potential Gain: 10 ticks (2.50 pts)
📊 Indicator Summary Table
Quick comparison: function, optimal use, and complementarities
DynamiDOM Heatmap Pro
PRIMARY FUNCTION
Visual memory of the order book - 10+ levels of liquidity history
IDEAL FOR
COMPLEMENTARITY
- 🔗 OrderFlow: Confirms historical levels
- 🔗 Liquidity: Context + real-time flow
REQUIRED LEVEL
OrderFlow Tracker Pro
PRIMARY FUNCTION
Real-time cumulative delta + Iceberg/Spoofing/Absorption detection
IDEAL FOR
COMPLEMENTARITY
- 🔗🔗 Heatmap: Validates historical levels
- 🔗🔗 Liquidity: Confirms institutional conviction
REQUIRED LEVEL
Liquidity Pulse Pro
PRIMARY FUNCTION
Liquidity flow monitoring (Pulling/Stacking) - Directional anticipation
IDEAL FOR
COMPLEMENTARITY
- 🔗 Heatmap: Flows on historical levels
- 🔗🔗 OrderFlow: Pulling + Delta = strong signal
REQUIRED LEVEL
🔗 Compatibility Matrix
🔗 = Compatible | 🔗🔗 = Strong Synergy (Priority use together)
| Heatmap Pro | OrderFlow Tracker | Liquidity Pulse | |
|---|---|---|---|
| Heatmap Pro | ● | 🔗 | 🔗 |
| OrderFlow Tracker | 🔗 | ● | 🔗🔗 |
| Liquidity Pulse | 🔗 | 🔗🔗 | ● |
💡 Usage Recommendation:
For an optimal setup, activate OrderFlow Tracker + Liquidity Pulse together (strong synergy 🔗🔗). Keep Heatmap Pro running at all times for historical context. This combination of 3 tools gives you a full vision: Past (Heatmap) + Present (OrderFlow) + Anticipation (Liquidity).
💡 Advanced Trading Patterns
Real-world use cases for ES and NQ using the 3 indicators
⚠️ Important Notice: The patterns shown below are provided for educational and illustrative purposes only. They do not constitute investment advice or an invitation to trade. Trading involves risks of capital loss. Every trader is solely responsible for their decisions and consequences. Neither DynamiDoxa nor NinjaTrader can be held responsible for an investor's potential losses. Only trade with capital you can afford to lose.
"Institutional Support Bounce" Pattern
Synergy: Heatmap + OrderFlow + Liquidity
📍 Market Context:
ES in an intraday bullish trend, pulling back toward a key support zone identified by Heatmap (e.g., 5850.00).
🗺️ Heatmap Pro: Level Identification
Spot an intense red zone (strong historical liquidity) around 5850.00. This level has been defended at least 3 times in the last 2-4 hours.
📊 OrderFlow Tracker: Absorption Confirmation
Wait for an iceberg (❄️) to appear at 5850.25 AND for sell delta to shift from heavily negative (-500 to -800) to near zero or positive in under 60 seconds.
💧 Liquidity Pulse: Conviction Validation
Confirm progressive BID stacking (green color intensifying across 3-5 levels). No massive pulling on the BID side = real conviction.
🎯 Trade Execution
Entry: BUY limit at 5850.50
Stop Loss: 5849.50 (1 point below iceberg) = 4 ticks
Take Profit: 5853.00 (1:2.5 ratio)
"Order Flow Confirmed Breakout" Pattern
Synergy: Heatmap + OrderFlow + Liquidity
📍 Market Context:
NQ rangebound for 1h, price approaching major resistance (e.g., 21200.00).
🗺️ Heatmap: Resistance Detection
Orange/red zone at 21200.00 = historical resistance (multiple rejections).
💧 Liquidity Pulse: Breakout Preparation
BEFORE the breakout: Watch for massive ASK pulling (sell orders removed) just below 21200.
📊 OrderFlow Tracker: Post-Breakout Validation
After break: Delta MUST remain heavily positive (+300 minimum) for 30-60 seconds.
🎯 Trade Execution
Entry: BUY stop at 21202.00
Stop Loss: 21198.00 = 4 points
Take Profit: 21210.00 (1:2 ratio)
"Fake Breakout Detection" Pattern (Anti-Spoofing)
Focus: OrderFlow Tracker + Liquidity Pulse
📍 Market Context:
ES approaching resistance, large visible sell wall (e.g., 1500 ASK contracts at 5855.00).
💧 Liquidity Pulse: Sell Wall Monitoring
Large ASK wall appears suddenly. Potential spoofing signal if this wall was not gradually present beforehand.
📊 OrderFlow Tracker: Spoofing Detection
If the wall disappears abruptly without being executed AND a spoofing symbol (⚠️) appears → It was a fake wall.
🎯 Trade Strategy
Entry: BUY market after spoofing detection
Logic: The true movement is about to happen now
Stop Loss: Tight (3-4 ticks)
Take Profit: Quick (6-10 ticks)
💡 General Tips:
- • Patience: Wait for convergence of all 3 indicators.
- • Context: These patterns work best during RTH (9:30 AM - 4:00 PM ET).
- • Risk Management: Never risk more than 1-2% of capital per trade.
- • Backtesting: Test in simulation (Playback) before trading live.
⚙️ Optimal ES & NQ Settings
Recommended configuration for maximum performance
Complete Documentation Provided
Detailed settings for ES and NQ, including optimal parameters for each session (RTH Open, Midday, Close, Globex), are provided in the complete PDF documentation delivered with your purchase.
📚 What the documentation includes:
- Setting tables by instrument (ES, NQ, YM, CL, GC...)
- Adapted parameters by session (RTH Open vs Midday vs Globex)
- Technical explanations of the DynamiDOM Core Engine
- Step-by-step installation guide with screenshots
- Advanced video tutorials
💡 Example Settings for ES RTH Open (9:30-11:00 AM ET):
• Iceberg Multiplier: 2.5 (high volatility)
• Delta Alert Threshold: ±500
• Volume Min Iceberg: 200 contracts
→ Full details in the PDF doc
⚡ What You WON'T See Elsewhere
Why DynamiDOM outperforms other Order Flow solutions
Other Order Flow Tools
-
No DOM History
The order book erases in real-time, making it impossible to see past liquidity zones.
-
Basic Iceberg Detection
Fixed thresholds that adapt neither to volatility nor to specific sessions.
-
No Spoofing Detection
Impossible to differentiate real walls from fake walls.
-
Isolated Indicators
Each tool works alone; no integrated ecosystem.
-
Blackbox / Closed Code
Impossible to understand the logic or customize the tool.
DynamiDOM Pack 1
-
Complete Historical Heatmap
Visual DOM memory across the entire session; instantly spot institutional levels.
-
Adaptive Iceberg Detection
Dynamic thresholds adjusted automatically to volatility and sessions.
-
Integrated Anti-Spoofing
Automatically detects fake walls and signals manipulation.
-
Unified DynamiDOM Core Ecosystem
Shared C# central engine → data consistency and optimal performance.
-
Accessible Source Code
Professional documented C# architecture, transparent logic, customization ready.
🔬 Professional Technical Architecture
The DynamiDOM Core Engine (file DynamiDOMCore.cs)
centralizes all Order Flow analysis logic. This modular architecture allows for:
- • Performance: Shared calculations between indicators.
- • Consistency: Same definitions for iceberg/spoofing across all 3 tools.
- • Scalability: Easy addition of new indicators without code duplication.
- • Maintenance: Centralized bug fixes.
✅ Our Guarantees
Your satisfaction is our priority
Quick Installation
Less than 5 minutes to install all 3 indicators. PDF guide + video provided.
Priority Support
Access to VIP Discord with responses within 24h maximum.
Free Updates
All future improvements free for life.
Complete Documentation
50+ page PDF + 5 tutorial videos.
Money Back Guarantee
14 days to test. Not satisfied? Full refund.
Flexible Licensing
License tied to your Machine ID. Changing PCs? Reactivation available via email.
🎯 Who Is This Pack For?
It IS FOR YOU if:
- ✓ You trade futures (ES, NQ, YM, CL, GC...)
- ✓ You use NinjaTrader 8
- ✓ You want to understand the market via Order Flow
- ✓ You seek an institutional edge without excessive complexity
- ✓ You are an active scalper, day trader, or swing trader
It is NOT for you if:
- ✗ You're looking for a magic robot that trades automatically
- ✗ You have zero basis in trading
- ✗ You only trade stocks or crypto
- ✗ You do not use NinjaTrader 8
- ✗ You want a "fire and forget" system without effort
Sign Up for the Preview
Be among the first to receive Pack 1 at launch
+ Get -20% off if you own Heatmap Pro V1
Registration Successful! 🎉
You will receive an email as soon as Pack 1 launches.
❓ Frequently Asked Questions
Everything you need to know before you start
Yes, absolutely! All 3 indicators work on all futures (YM, CL, GC, 6E, etc.) and even on forex and stocks if you have market depth data (Level 2). The provided ES/NQ settings are optimized for those instruments, but you can adapt parameters (via indicator properties) for other markets.
No. Pack 1 is developed exclusively for NinjaTrader 8. The C# architecture and APIs used (notably for SuperDOM and Market Depth event handling) are not backward compatible with NT7. If you're still on NT7, we strongly recommend migrating to NT8.
The license is tied to a Machine ID (your PC's unique footprint). One license = 1 computer. If you change PCs or reinstall Windows, contact us via email with your license key: we will reactivate it for free on your new machine (limit: 2 transfers per year). You also have a 3-day free trial to test before purchasing the full license.
For reliable Order Flow, you need real-time CME data. Recommended brokers for NinjaTrader:
- • NinjaTrader Brokerage: Perfect native integration, CME data included.
- • Interactive Brokers: Excellent data, but requires separate CME subscription.
- • Rithmic: Very low latency, ideal for scalping (via a Rithmic-compatible broker).
⚠️ Avoid brokers with "simulated" or aggregated data - Order Flow will not be reliable.
No, on the contrary! The DynamiDOM Core Engine architecture centralizes all calculations. Instead of having 3 separate indicators analyzing the market, they share the same engine → reduced CPU consumption. In practice, Pack 1 consumes less than a single poorly optimized basic indicator. Minimum recommended specs: 4-core CPU, 8 GB RAM.
Yes, completely! You receive the full C# source code, commented in French. You can change colors, adjust detection thresholds, add your own alerts, etc. Condition: You cannot resell or redistribute the modified code. It is for personal use only. If you have development questions, our support can guide you.
Pack 1 contains 3 indicators:
- • Heatmap Pro (DOM history)
- • OrderFlow Tracker Pro (Delta + Icebergs + Spoofing)
- • Liquidity Pulse Pro (Pulling/Stacking)
If you already own Heatmap Pro V1, you get -20% off Pack 1. You will then have access to the 2 additional tools + the unified DynamiDOM Core ecosystem.
No subscription at all! It is a one-time payment. Once bought, Pack 1 is yours forever, with all free updates included. We hate hidden subscriptions as much as you do. 💚
📖 Order Flow Glossary
Definitions of technical terms used
Cumulative Delta
The difference between market buy volume (aggressive buyers) and market sell volume (aggressive sellers), accumulated tick by tick. A positive delta (+500) means 500 more contracts were bought than sold = buying pressure.
Absorption
A phenomenon where a price level "absorbs" massive opposing orders without moving. Ex: sellers hit a support level, but price doesn't drop → buy absorption (institutions are defending the level).
Iceberg Order (Hidden Order)
A massive institutional order of which only a small part is visible in the order book. The rest "reloads" automatically after each partial execution. Symbol: ❄️ in OrderFlow Tracker Pro.
Spoofing (Fake Wall)
Manipulation: placing a large order in the DOM to mimic pressure (e.g., sell wall), then abruptly removing it without execution before price reaches it. Goal: to trick other traders. Symbol: ⚠️ (yellow border).
Pulling & Stacking
Pulling: Fast, massive withdrawal of liquidity (orders
removed from DOM).
Stacking: Progressive addition of liquidity (orders
stacked across multiple levels). Stacking = conviction, Pulling = potential manipulation.
DOM History (Depth of Market)
Visual recording of past liquidity levels in the order book. Heatmap Pro preserves this memory via color gradients (gray → orange → red) indicating where volume historically concentrated.
Market Depth
Order book displaying BID (buy) and ASK (sell) orders pending at each price level. Essential for Order Flow: reveals where liquidity is located before execution.
RTH vs Globex
RTH (Regular Trading Hours): Main session
(9:30 AM - 4:00 PM ET for ES/NQ) → High volume, high volatility.
Globex (ETH): Extended electronic session
(6:00 PM - 9:30 AM ET) → Lower volume, less liquidity.
💡 Tip:
These terms are essential for understanding the institutional language of the market. The PDF documentation provided with Pack 1 contains an even more comprehensive glossary with visual examples.
Ready to Trade Like an Institutional Player?
Join traders already using DynamiDOM to decode institutional intent in real-time.